
Forget the AI Bubble: This Hidden Liquidity Squeeze Moved the Entire Market
The liquidity shortage that tightened the system, hit mega-caps, and steered the whole market this month.

What a month it has been for the markets so far and the craziest part? We’re only halfway through it.
November is supposed to be one of the calm, friendly months for stocks.
Historically, Since 1927, the S&P has finished higher in 59% of Novembers.
In the first year of a presidential cycle, it’s even stronger at 67%.
When the market heads into November already up 15%+ year to date, it still manages to squeeze out another +2.7% on average.

So in theory, this month should’ve felt steady but instead, it’s been a constant up and down like the market can’t decide what mood it wants to be in.
Every day comes with a new explanation for why things feel off.
• AI bubble chatter.
• Government Shutdown.
• Burry resurfacing again.
• Peter Thiel selling.
It’s been a constant stream of theories and if you’ve been watching all of that, it’s fair to wonder:
“Is this actually why stocks feel so unstable right now?”
If anyone tells you yes, they’re not right.
Great headline material but none of them were the real driver.
The actual reason is something so dull that most people mentally check out the moment you bring it up.
But it’s also the one thing that moves everything when it tightens: the financial plumbing.
The First Hint Something Was Off
To understand what went wrong, you have to know what SOFR actually is.
SOFR is the interest rate big financial institutions pay to borrow cash overnight.
Think of it as the market’s quick loan rate, the cost of getting cash for just one night, backed by Treasuries.
When the system has plenty of money floating around, SOFR stays low and predictable.
It usually sits below the Fed’s floor rate because borrowing cash should always be cheaper than parking it at the Fed.
That’s how the plumbing works in a healthy system.
But this time, it didn’t behave.
By End of October, SOFR spiked more than 30 basis points above the Fed’s own rate.
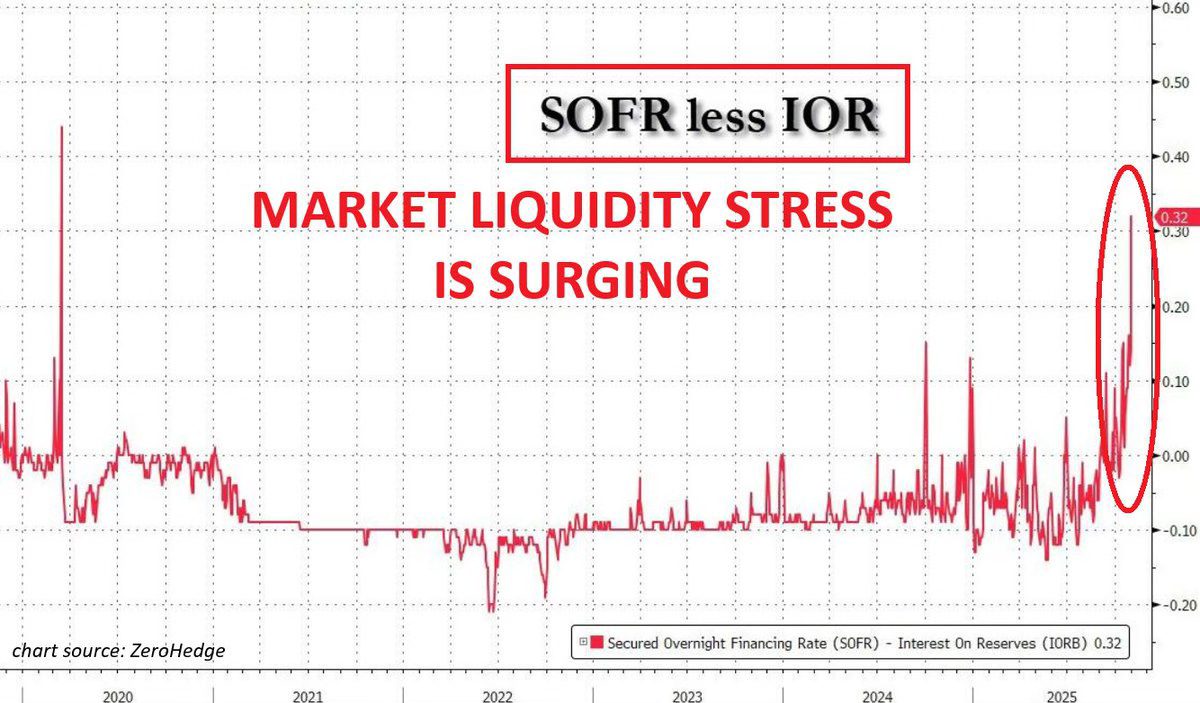
That’s a red flag that big players were suddenly competing for overnight cash because there wasn’t enough of it.
When SOFR moves like that, it’s the equivalent of the market saying,
“Someone turn the faucet back on, we’re running low.”
And the confirmation came fast.
The Fed’s emergency repo window, the Standing Repo Facility was tapped for more than $50 billion.
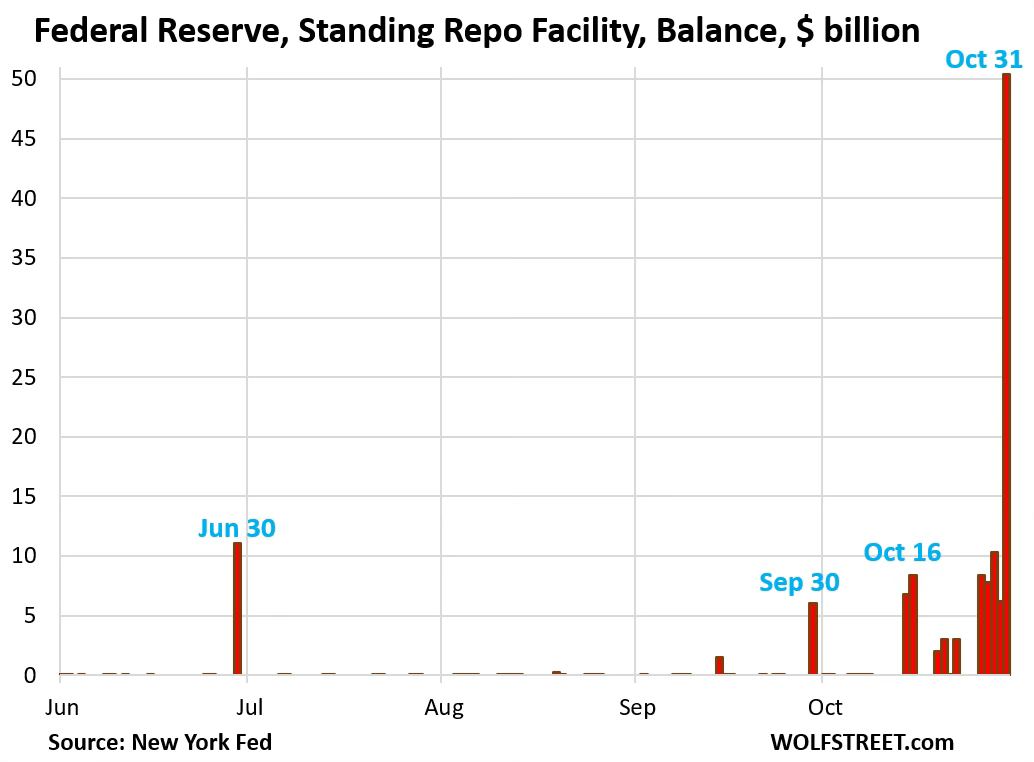
No one touches that unless borrowing in the private market becomes either too expensive or too difficult.
That was the moment the picture became clear: This wasn’t normal tightening.
This was real liquidity scarcity and markets were about to feel it.
How We Ended Up Here
A few different forces all hit the system at the exact wrong time, and together they drained money faster than the market could handle.
First was the government shutdown.
When the government shuts down, Treasury has to hoard cash because it doesn’t know exactly when it will reopen or how funding deadlines will shake out.
So it piles money into its account at the Fed, basically the government’s checking account. That balance shot up to around $1 trillion.
 displays an orange line graph rising sharply in October with a red circle and arrow highlighting the peak near 1000 billion dollars, x-axis labeled from Jan 25 to Oct with months like Feb 25 Mar 25 Apr 25 May 25 Jun Jul 25 Aug 25 Sep 25 Oct, y-axis from 0 to 1200 in increments, source noted as U.S. Treasury at bottom.")
Here’s the part nobody realizes: Every dollar that lands in the Treasury General Account (TGA) comes out of the banking system.
So if the TGA jumps by hundreds of billions, that’s hundreds of billions less available for banks, funds, or the repo market.
Then there’s QT, the Fed shrinking its balance sheet. Over the last two years, more than $2 trillion has already been removed.

Early on, it wasn’t a big deal because the system had extra cash sitting around in places like the reverse repo facility but that extra cash is gone now.
Every dollar the Fed pulls now hits the part of the system that actually matters.
That combination is brutal for liquidity.
When all of these hit at once, the system tightened hard and fast.
And that’s exactly what happened. So what’s next and what does this all mean for the markets?
Why the Selling Hit the Biggest Names First
Once liquidity tightened, hedge funds and other leveraged players didn’t really get to choose what they wanted to do, the market chose for them.
Consider Becoming a Paid subscriber to keep reading: These deep dives takes hours of work. Upgrade for just $99 a year (others charge $100+ monthly) to keep this newsletter going and get the insights that really matter.
Keep reading with a 7-day free trial
Subscribe to Investinq to keep reading this post and get 7 days of free access to the full post archives.