
Is the Year-End Rally Already Starting But What’s Actually Powering It?
It’s not magic, it’s math, mechanics, and money chasing performance.

It’s that time of year again. Not holiday shopping season. Not Starbucks red cups.
It’s the moment the stock market flips a switch, when October chaos sets the stage for one of the most reliable money-making streaks in history.
Since 1928, this pattern has shown up like clockwork. Around October 20th, the stock market tends to hit a turning point, statistically, it’s the best single trading day of the year for the S&P 500, with an average gain of 0.57%. But right after that? The market usually gets messy.
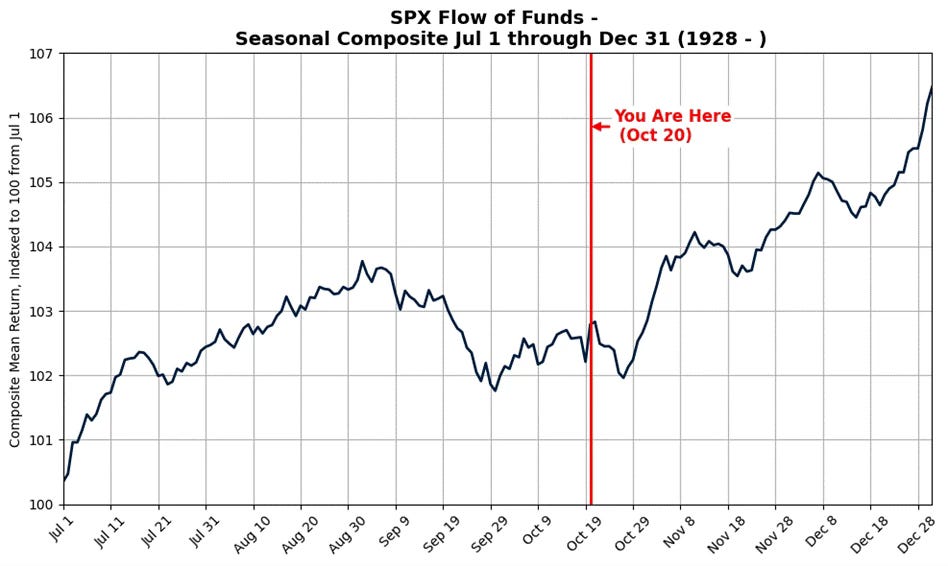
The last stretch of October often looks like confusion on steroids. Stocks jump and drop without warning. Trading volumes thin out, meaning there’s less buying and selling happening at any given price (that’s what traders call “low liquidity”). And behind the scenes, nearly 718 mutual funds managing about $2 trillion start selling or “rebalancing” their portfolios before their fiscal year ends.
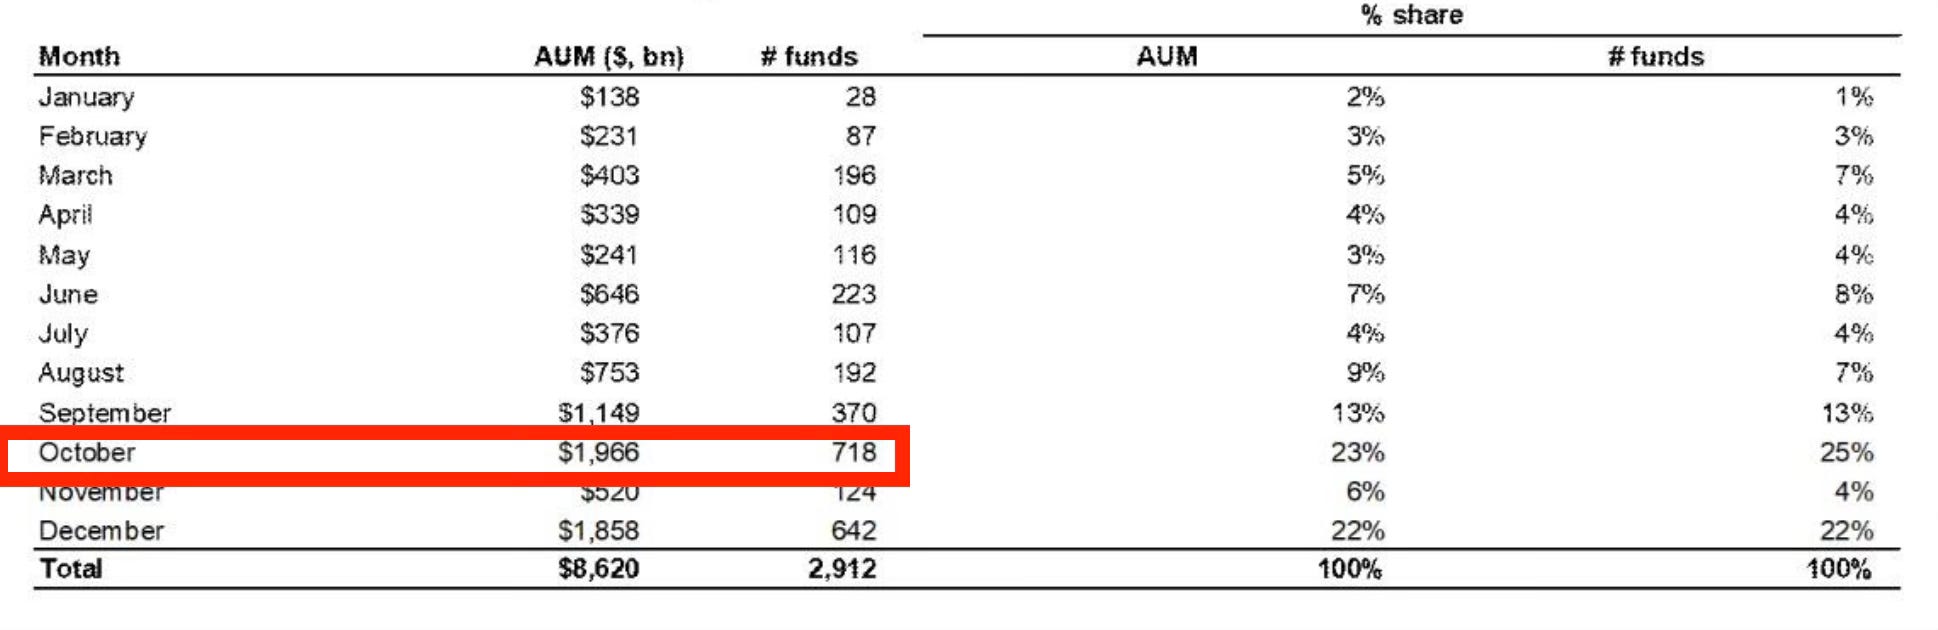
If you’re wondering what “mutual funds” are, they’re giant pools of money that invest on behalf of millions of people. When their accounting year ends, these funds clean up their books, sell underperforming stocks, and prepare to show investors tidy, impressive-looking statements. All that activity creates temporary chaos.
To most people, it looks like the market’s lost its mind. But this brief turbulence? It’s actually the setup for what’s called the year-end rally, one of the most consistent and profitable stretches of the entire year.
The Calm After the Chaos
Once that fiscal-year cleanup ends, something special usually follows. Historically, from late October through December, the S&P 500 which represents the 500 largest U.S. companies gains about 4.16% on average. The Nasdaq, which tracks more tech-heavy companies, often climbs even higher.
This happens almost every year for a few big reasons, part human behavior, part fund mechanics, part timing.
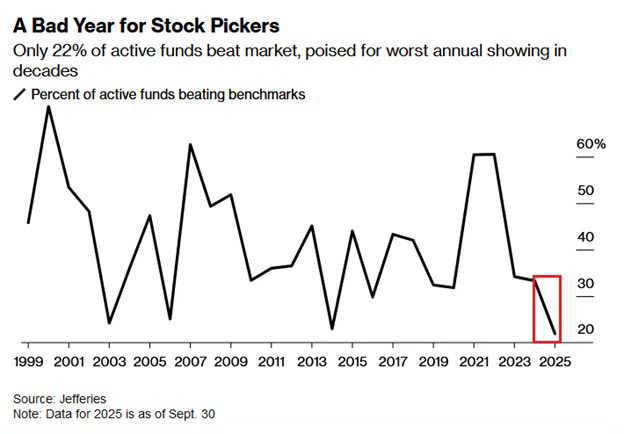
Let’s start with behavior what professionals call performance chasing. Every year, fund managers are judged by how well they perform compared to the overall market (in most cases, the S&P 500). If they lag behind, it looks bad to clients.
This year, roughly 78% of active managers are underperforming the S&P 500. That means most of them are scrambling to “catch up” before the year ends. And the fastest way to look better is simple: buy the stocks that have already been winning all year.
That’s what “performance chasing” means investors rushing to pile into whatever’s hot so their portfolios look stronger by year-end. Think of it as financial FOMO.
This behavior creates a loop: the more money that flows into the winners, the more those stocks rise, which attracts even more money, and so on. The result is a wave of buying pressure that helps fuel the rally.
Window Dressing: The Year-End Facelift
Another big driver is something called window dressing.
It sounds like something you’d do to decorate a store, and honestly, that’s not far off. Right before year-end, fund managers “dress up” their portfolios to make them look more attractive. They sell off lagging stocks, the ones that performed poorly and replace them with the ones that did well, like Nvidia or Tesla.
So, when clients receive their year-end reports, it looks like their money was always invested in the biggest winners. In reality, many of those positions were added at the very end of the year.
This practice might sound superficial, but it creates real buying pressure. When thousands of funds all start dumping the same losing stocks and chasing the same winners, demand for those “good” stocks spikes, and prices rise even more.
That’s why November often feels like the market just “found its rhythm” again, it’s not luck. It’s the entire fund industry rearranging its house.
The Buyback Comeback
Now, here’s where corporations themselves jump in and add fuel to the fire.
Throughout the year, many big companies buy back their own share, a process called a stock buyback. It’s exactly what it sounds like: the company purchases its own stock from the market. This reduces the total number of shares available, which often pushes the stock price higher (since there’s less supply but the same demand).
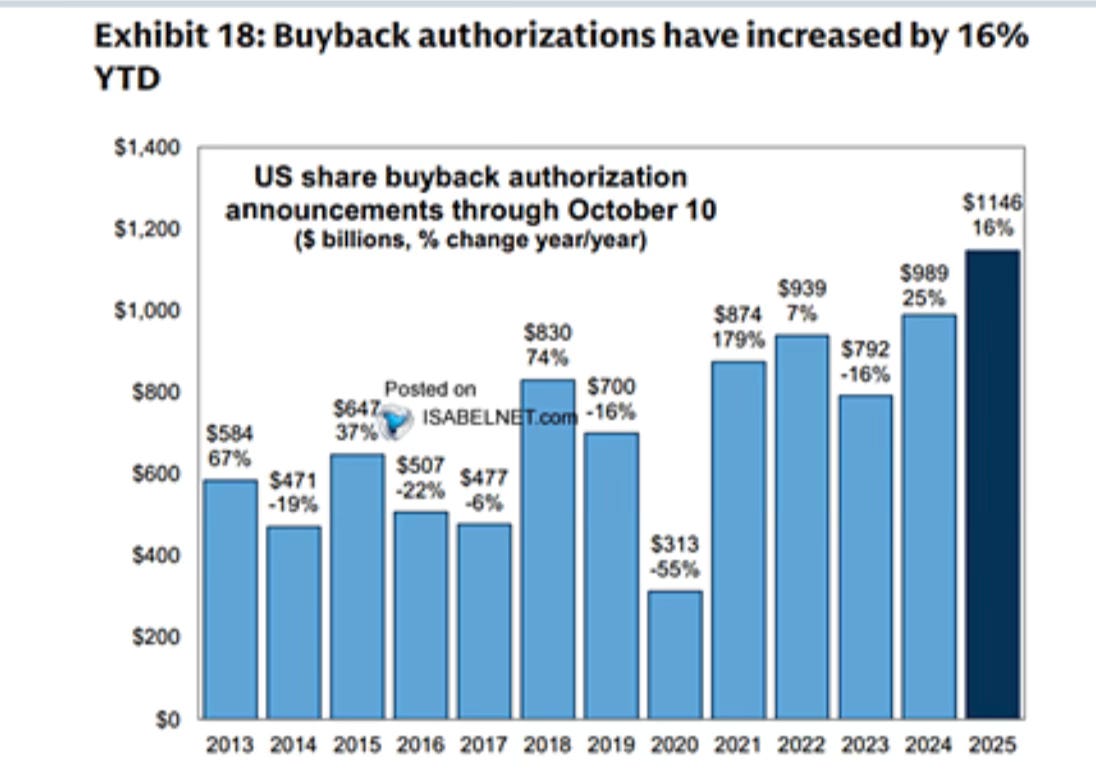
However, companies usually pause buybacks during earnings season, that’s when they release financial results to avoid any appearance of insider trading. Once those blackout periods end, typically around October 24, the floodgates reopen.
And this year, those buybacks are roaring back stronger than ever. Trading desks have reported that buyback authorizations have increased by 16% year to date. These buybacks create steady, reliable demand for shares just as mutual fund selling slows down, a perfect setup for rising prices.
Follow the Flows
Meanwhile, investors around the world are quietly adding money to stock funds.
In mid-October alone, global equity funds saw $28 billion of new inflows, meaning fresh money entering the market. Even though bond funds (which are typically safer investments) slowed down, investors were moving back into stocks.
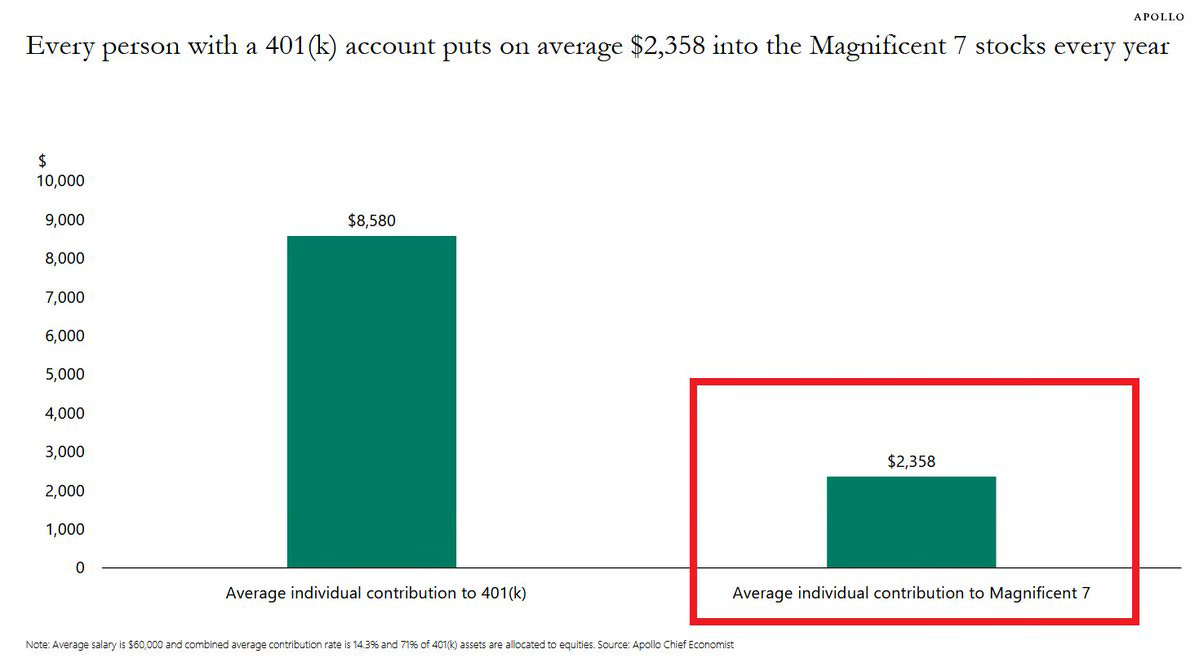
These steady inflows matter because they create consistent demand beneath the surface. Every time someone contributes to a 401(k), a retirement plan, or an index fund, part of that money gets invested automatically. The average American worker invests roughly ~$2,358 a year into the Magnificent 7 through their 401(k). In other words, passive inflows keep fueling these stocks regardless of the outlook - good or bad. That’s passive buying, money flowing into stocks without any emotional decision-making and it supports prices over time.
The Santa Claus Rally: Fact, Not Fairy Tale
All of this, the buybacks, the performance chasing, the fund cleanups, and the fresh inflows builds into something traders have nicknamed the Santa Claus Rally.
The Santa Claus Rally is the last five trading days of the calendar year and the first two trading days of the new year. Since 1950, the S&P 500 has averaged a +1.3% gain during this period and has only been negative in back-to-back years twice.
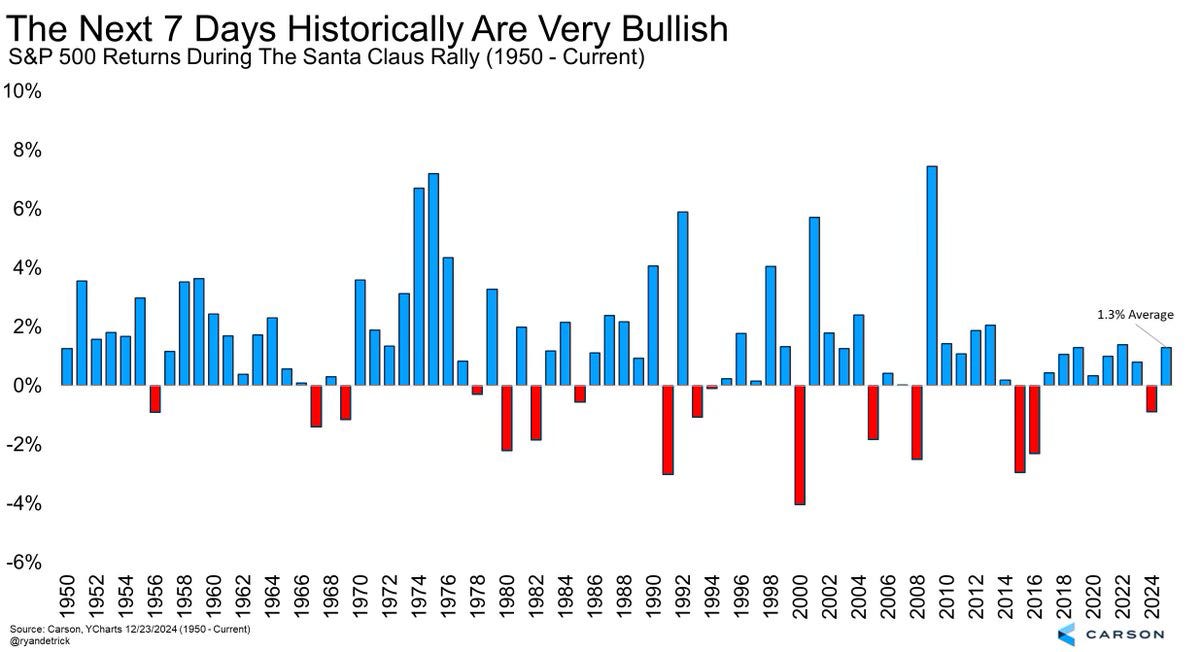
That’s why traders and strategists pay such close attention to it, it’s one of the most statistically bullish stretches in the market.
Please read this message to continue: I’ll be honest with you, putting these deep dives together takes a ton of work. That’s why I highly recommend you upgrade. I only charge about $99 a year, while competitors charge over $100 a month for email such as this. There’s so much value packed into each one, and your support not only keeps this newsletter going but makes sure you never miss the insights that really matter.
Keep reading with a 7-day free trial
Subscribe to Investinq to keep reading this post and get 7 days of free access to the full post archives.