
The Rally Bears Can’t Kill, No Matter How Hard They Try
What last week’s panic, flows, and data really say about the market’s strength.

Last week, it felt like the market forgot how to breathe.
Social media was full of people who’d been bullish for months suddenly talking like they’d just discovered risk.
And then like clockwork, it all stopped.
Stocks rebounded. Flows stayed positive. Companies kept buying back shares.
Within a few days, the crisis had evaporated, and everyone went back to debating whether AI chips are in a bubble.
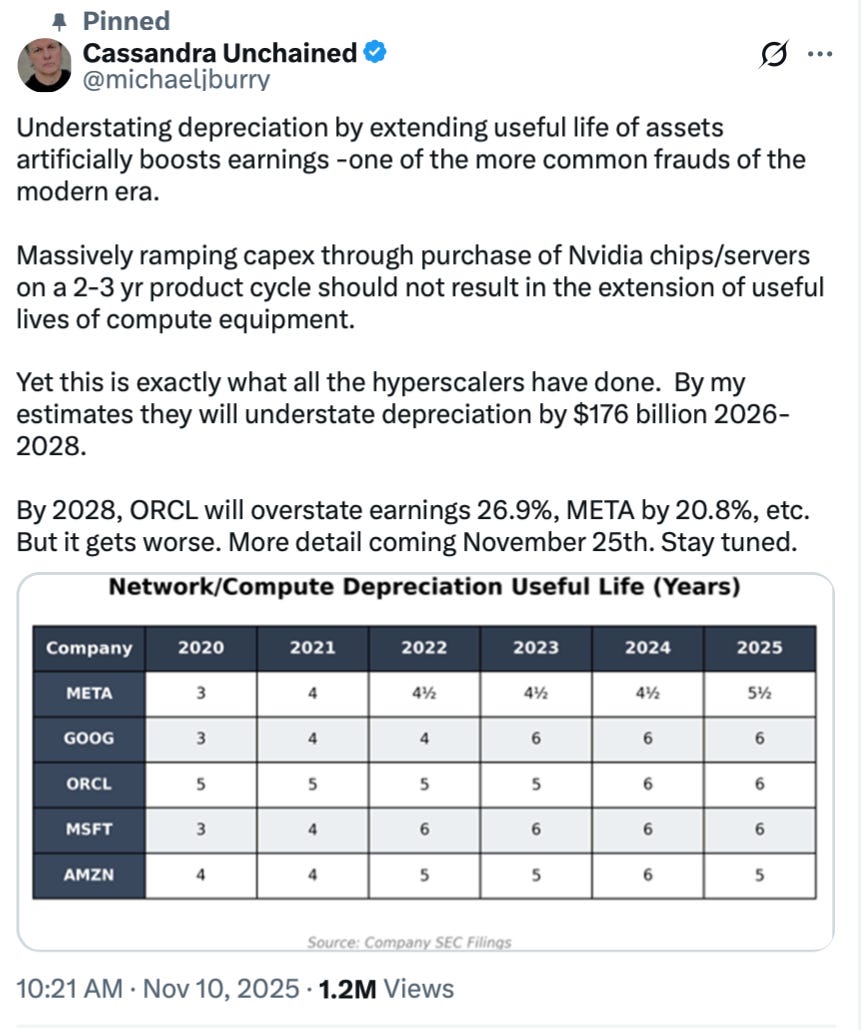
Even our favorite bear, Michael Burry, was back today, posting a chart and a warning about depreciation fraud.
Last week wasn’t the start of a crash. It was the market doing what strong markets do, shaking out weak hands and rewarding the patient.
And I’ve been screaming this from the rooftops since the day I launched this newsletter back in September: stay bullish at least till the year end.
But I know the question still lingers in your mind: Are we really back yet?
That’s what this edition is about to walk you through the data, the psychology, and the underlying structure so you can form your own conclusion.
Because if you strip away the noise on social media, the story the market is telling right now is a lot clearer than it looks on your feed.
First up: The Government Shutdown
Remember back in 2019, when the last major government shutdown dragged on so long that the White House literally had to order Big Macs to feed championship athletes?

Yes, that actually happened.
With much of the staff furloughed, the White House ended up serving the Clemson University football team a buffet of McDonald’s, Wendy’s, and Burger King.
Now let’s reel it back to reality. While that moment went viral for laughs, today, there are thousands of federal workers and families lining up outside food pantries just to get by.

Paychecks have been missed, savings are running thin, and Snap benefits are only partially funded across the US.
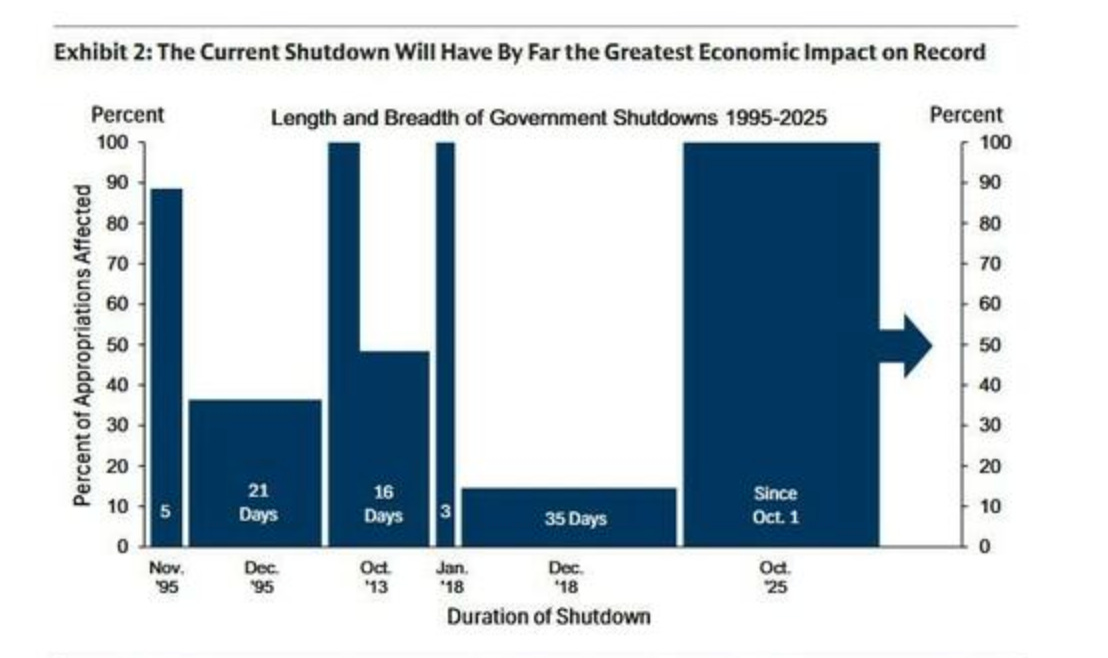
However, the Senate finally voted to reopen the government, marking what could be the beginning of the end for the longest shutdown in U.S. history.
But make no mistake, even if the lights are coming back on, the damage has already been done economically and socially.
For more than a month, the Treasury kept collecting taxes and selling bonds.
That decision trapped over a trillion dollars in government accounts, money that normally circulates through banks, payrolls, and the broader economy.
Liquidity dried up. Markets tightened and the economic fallout wasn’t small.
Goldman Sachs estimates the shutdown shaved 1.15 percentage points off Q4 GDP growth, the largest hit from a government stoppage on record.
Analysts expects some rebound in early 2026 as delayed spending and back pay filter through the system, but the lost momentum will sting.
But reopening the government doesn’t erase the strain.
Key data releases including the jobs report and CPI were delayed, clouding visibility for investors and policymakers alike.
And while liquidity is now set to flow back into the system, relieving some of the pressure that’s built in funding markets.
Congress only extended funding through January, which means we could be right back here in two months if nothing changes.
Keep in mind the house and the president still needs to approve this.
So yes, reopening is good news for the markets in the near term.
Cash starts moving again, people finally get their paychecks and benefits, banks breathe a little easier, and risk assets catch a much-needed tailwind.
The Flows Actually Flipped Positive on the Dip
This is the part that immediately made me perk up: $29 billion in net global equity fund inflows for the week ending November 5.
Up from $17 billion the week before.
Think about that for a second. We just had a pullback. A real one and instead of capital going “okay, time to get cautious,” it went “time to buy more.”
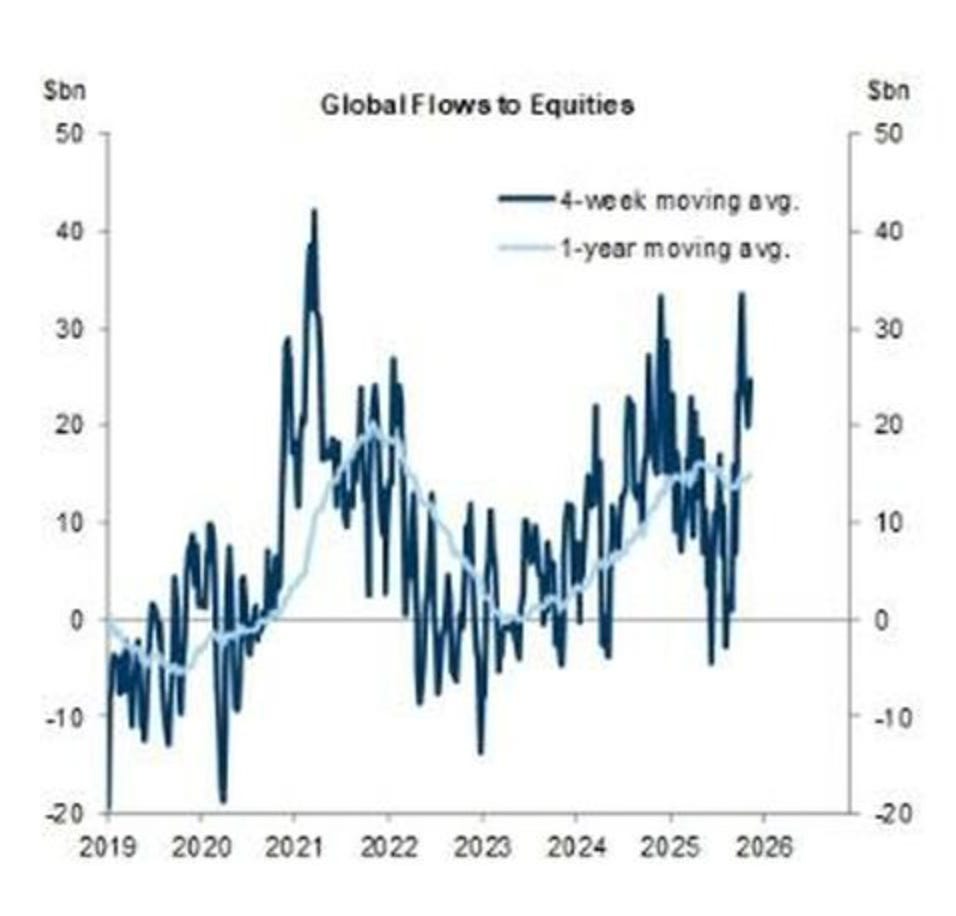
US equity funds got all of it and tech funds specifically.
Here’s the historical thing that actually matters: when you’re up 10% into November which the market was and then you get a negative first week in November, what happens through year-end?
The median return is 3.59%. Average is 2.82%.
I know that doesn’t sound insane, but that’s the point. After being up 10% for the year, getting another 3-4% move in six weeks is the continuation.
That pattern has repeated enough times that pros recognize it instantly.
And here’s the thing about flows that most people miss: flows tell you what capital thinks is going to happen next. Price tells you what already happened.
Flows tell you what the smart money thinks is coming and right now it’s titled upwards.
Is Value Is Starting to Actually Wake Up?
Here’s the thing that actually matters for the next leg of upside, because mega cap tech can’t carry the entire market forever.
Consider Becoming a Paid subscriber to keep reading: These deep dives takes hours of work. Upgrade for just $99 a year (others charge $100+ monthly) to keep this newsletter going and get the insights that really matter.
Keep reading with a 7-day free trial
Subscribe to Investinq to keep reading this post and get 7 days of free access to the full post archives.